Basic Electrocardiography Interpretation

Unidad de Apoyo para el Aprendizaje


Proyecto PAPIME Clave: PE308817

Start

Introduction


Click on the arrows to view introductory information about electrocardiography and the heart.


In this unit, you will study the electrocardiogram (ECG) as the graphic representation of the electrical activity of the heart and its diagnostic usefulness when the electric activity is altered by a disease. As a result of this alteration, the ECG is modified.

Click on the arrows to view key questions about electrocardiography.


To recognize the essential components of the electrical system of the heart and electrocardiography, through anatomical explanation, the conduction system and electrocardiographic diagrams in order to identify main heart alterations.

External anatomy of the human heart

Lorem ipsum dolor sit amet

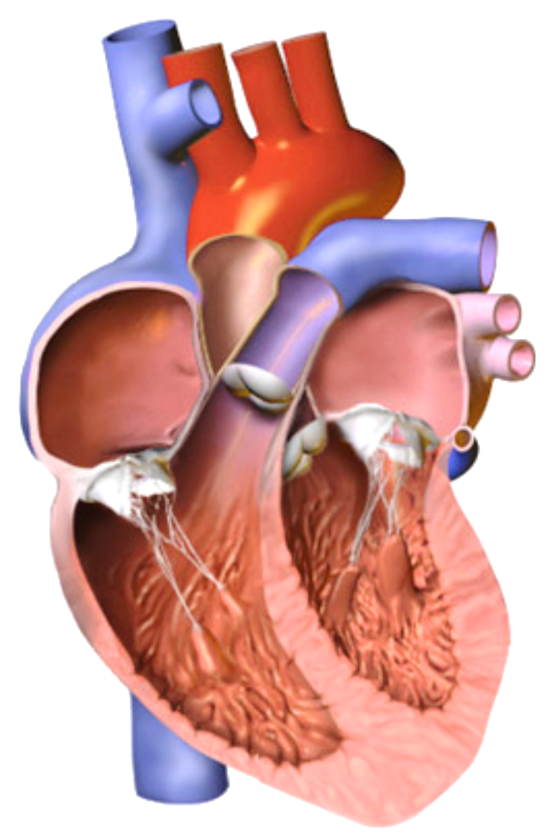
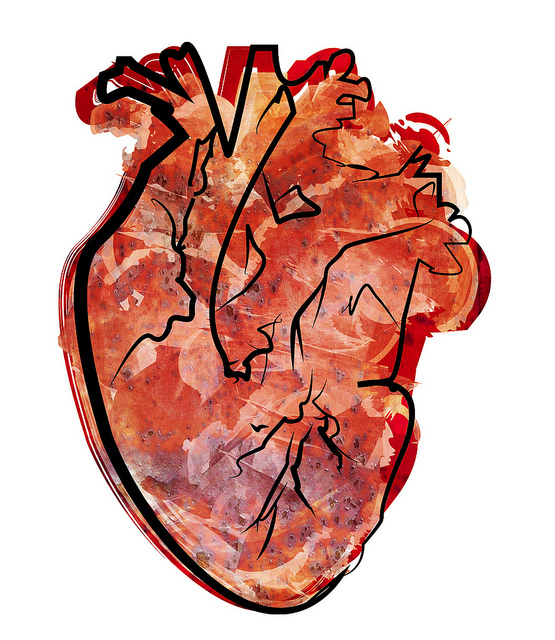
On the external part of the heart, we find the origin of the great veins (superior vena cava and inferior vena cava) that transport blood from the heart to the tissues, and from the tissues to the heart.

Click on each physical feature of the heart, to display its definition.


The heart is a dynamic activity muscle, located in the middle mediastinum, inside the thoracic cavity. It is surrounded by the pericardium, a thin two-layer sack which contains liquid. This liquid surrounds the heart and constantly lubricates its external surface, allowing it to move easily during contraction.


Location of the heart in a front view of a human figure

Wikipedia. (n. d.). Heart-near [imagen]. Tomada de https://commons.wikimedia.org/wiki/File:Heart_rotating.gif

In a schematic way, the heart is like a pyramid, laying on one of its sides, with the tip down, upfront and rotated a little bit to the left, while the base is down, and a bit rotated to the right. (Hanzlick and Rydzewski, 1990).


Graphic of the human heart

Pixabay. (2016). Corazón humano [imagen]. Tomada de https://pixabay.com/es/coraz%C3%B3n-sangre-%C3%B3rgano-humano-latir-1765298/

Leaving diseases aside, and as it happens with other organs, many factors may have an influence in the heart’s weight: gender, age, body mass index (BMI), ethnic group or life quality. This being said, a male adult’s heart may weigh between 270 and 275 grams. An adult female’s heart may have an average weight of 250 grams.


Human Heart

Urías, U. (2013). Corazón [fotografía]. Tomada de https://www.flickr.com/photos/97632268@N05/9069664787/in/photolist-ePspmP-4DJU7y-5TkCRM-7jKCJu-7jfWid-81Coqv-8e51oR-5ryTh7-9RXuse-Kt699-9s2G59-CHuJGT-7jjwkc-x1X4aF-71B7DN-qcH3YB-bdvoZB-7nsuth-cFHctu-aie17Y-CmkvjJ-aie2TJ-dfYodr-7qZ4iH-7w78gh-aie3Zs-6b1v5n-2Vqnj6-VGZUZ9-8NCZ79-aie5cw-8seV7D-719qZu-YGJx6N-qCHN5Y-5ujtBW-aebhoT-7EYAtL-79VQ1f-WfKRHN-7HroQY-8QCJF3-aie23Q-F8Qxn5-4nKGKg-6hTMfB-egMeJx-aibftr-4nKGL4-4j7Unn


Click on the image to recognize the external anatomy of the heart.


External anatomy of human heart

Wikipedia. (n. d.). Atresia tricuspídea [imagen]. Tomada de https://commons.wikimedia.org/wiki/File:Tricuspid_atresia-es.svg

Internal anatomy of the human heart


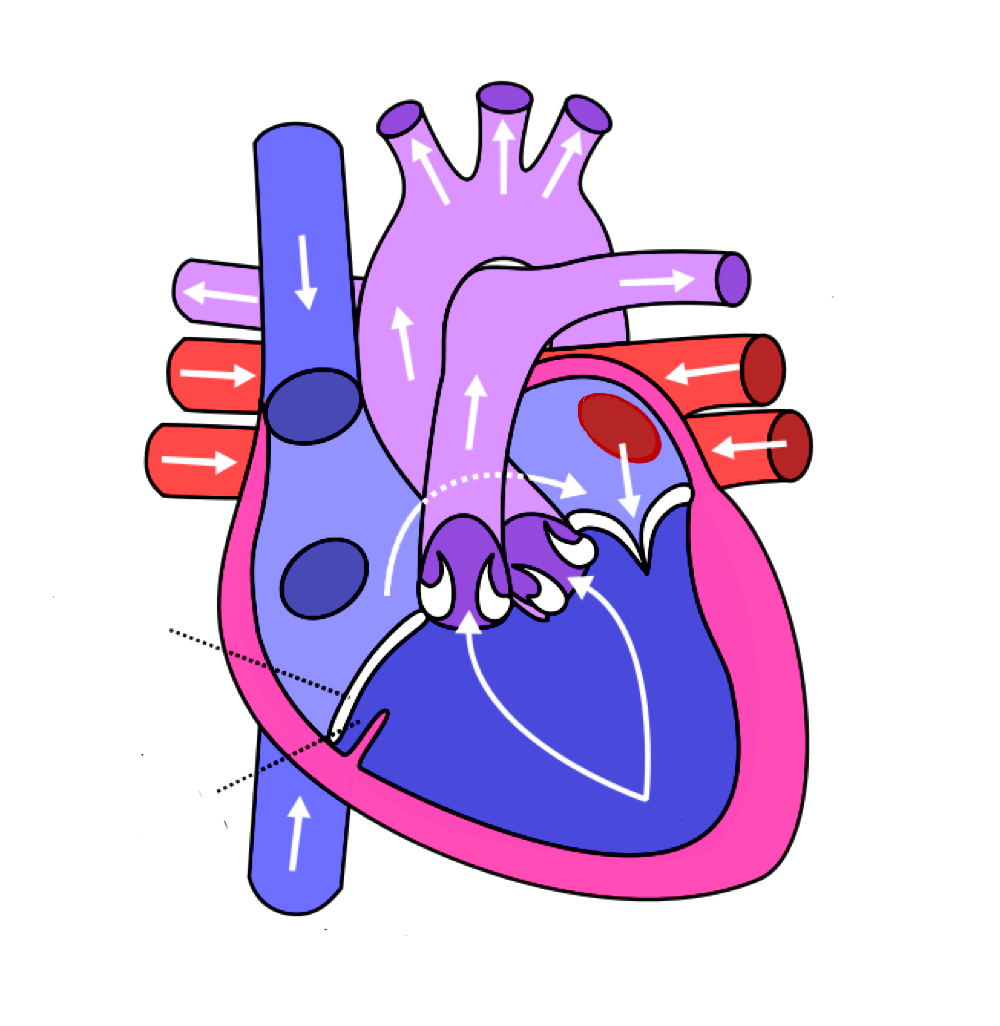
On the inside, the heart is divided in four chambers: two upper chambers known as atria (the left atrium and the right atrium) and two lower chambers called ventricles (the left ventricle and right ventricle). These are connected by valves. In order to describe the heart in its interior, we will go on the usual direction followed by circulation.

Click on the image to identify the internal anatomy of the heart.


Wikipedia. (n. d.). Cardiac Valves [imagen]. Tomada de https://commons.wikimedia.org/wiki/File:Heart_valves_*_V%C3%A1lvulas_cardiacas.png

Heart conduction system


Representación básica de la conducción eléctrica del corazón

Wikipedia. (n. d.). Basic representation of cardiac conduction [gif]. Tomado de https://commons.wikimedia.org/wiki/File:Basic_representation_of_cardiac_conduction.gif


Click on to check the electrical function of the heart.

Electrocardiogram and the interpretation method


Click on each component of the electrocardiogram to review its description.

Electrocardiograph

It is an electrical device that captures the electrical potentials of the heart; records the voltage that it generates and transmits through the body to a system of electrodes, cables and a recording console. The electrodes can be found in the form of clamps for the extremities and pacifiers or self-adhesive patches for the thorax.

Electrocardiograph

Gallardo, L. B. (2018). Electrocardiograph equipment [illustration].

The electrocardiograph record

It is done on a millimeter paper calibrated at 10 mm / mV in the vertical plane and a speed of 25 mm / s in the horizontal plane, so that horizontally 1 mm corresponds to 0.04 seconds, 5 mm to 0.2 seconds and 25 mm to 1 second. Vertically, 1 mm corresponds to 0.1 mV (Guadalajara, 2006).

Record of amplitude and time

Gallardo, L. B. (2018). Record of amplitude and time [illustration].

A vector

It is a line segment with direction and sense; its graphic form consists of an arrow where the tip represents a positive charge (+) and the tail a negative (-). In this way, depolarization vectors can be recorded and calculated to graphically display on paper with positive or negative deflections, depending on whether they move away from or approach the scanning electrode. Therefore, the difference in charges between two points is called the dipole theory (Guadalajara, 2006).

Every vector has a positive and a negative pole, as well as a middle or central point that has a value of zero or zero. If a registration electrode faces the positive charge of the vector, a positive deflection will be inscribed, and if it faces the negative charge, the deflection will be negative. If the recording electrode has a situation perpendicular to the vector, an isodiphase deflection will be registered, whose net voltage is zero (Guyton y Hall, 2011).

Dipolo

Gallardo, L. B. (2018). Dipole [illustration].

The Axis Derivations

There are 12 derivations, described by Einthoven, as the vertices of an equilateral triangle, with the heart in the center of it. Scanning electrodes placed on specific parts of the body record the depolarization vectors. As the heart can not be seen from only one place, as is a three-dimensional organ, it has to be seen from different places to assess the electrical activity (Guadalajara, 2006). The main planes used are the horizontal and the frontal, depending on the place where the electrode is placed and will be the electrical characteristics that we will appreciate. The derivations can be divided into:

  • Bipolar (DI, DII, DIII)
  • Monopolar (aVR, aVL, aVF)
  • Precordial or horizontal plane (V1,V2, V3, V4, V5 y V6)
Axis Derivations

Gallardo, L. B. (2018). Axis Derivations [illustration].

Cardiac electrical axis

It indicates the average direction toward where the process of depolarization or repolarization of cardiac cells is going. Your information is valuable for clinical practice, since it may indicate, in the first instance, alterations in the disposition of the heart and not necessarily indicate a pathology (Guadalajara, 2006). In itself, the electrical axis is no more than the direction of the total vectors of depolarization of the ventricles. Its calculation is very simple, we only look at whether the QRS of the DI and aVF leads is positive or negative. With these data, we can determine if the cardiac axis is normal or is deviated.

  • If the QRS in DI and aVF is positive, the axis is normal.
  • If the QRS in DI and aVF is negative, the axis has an extreme excursion.
  • If the QRS is negative and aVF is positive, the axis is deviated to the right.
  • If QRS is positive in DI and negative in aVF, it is necessary to evaluate derivation II: if it is positive in DII, the axis is normal; if it is negative in DII, the axis is deviated to the left.
Cardiac Electrical Axis

Gallardo, L. B. (2018). Cardiac Electrical Axis [illustration].

Indications of the electrocardiogram

Gallardo, L. B. (2018). ECG [illustration]


Click on each part of the electrocardiogram, to display what each one represents.

Indicates depolarization of both atria; it has a round morphology, with a duration of up to 0.10 seconds —2.5 mm— and a voltage of 0.25 mV —2.5 mm—. It is positive in all leads, except on aVR, which is negative (Guadalajara, 2006).

Represents the physiological delay of the stimulus coming from the atria as it goes through the atrioventricular node (AV). It is measured from the beginning of the P wave, to the beginning of the Q o R wave. Its duration must be from 0.12 to 0.20 seconds (Guadalajara, 2006).

It represents ventricular depolarization; its duration ranges from 0.06 to 0.10 seconds; it has different morphologies and it can be mainly positive, negative or biphasic —with both a positive and a negative portion—. The first negative wave appearing on the complex is called Q wave and it is very small, almost imperceptible when there is no infarction of any kind; the following wave to appear in the complex is positive, called R wave and the second negative wave appearing in the complex, after the R wave is called the S wave (Guadalajara, 2006).

It is a period of inactivity which separates ventricular depolarization from ventricular repolarization. This segment is normally isolectric and goes from the end of the QRS complex to the beginning of the T wave. (Guadalajara, 2006).

Concludes a heartbeat and represents repolarization of the ventricles. Usually, it is of less amplitude than the preceding QRS, it is asymmetric and its top amplitude is less than de 0.5 mV —5 mm—.

Heart rate

It is very important to determine the heart rate of an electrocardiogram (ECG), since it shows the presence of tachycardia or bradycardia and it may bring light on suspicions about certain pathologies. The easiest way to calculate the heart rate, as long as there is a regular rhythm, is to locate an R wave that matches a thick line on the graph paper; after that, we count the number of large boxes to the next R wave; we divide 300 by the number of large boxes; for example, if there is a box between two R waves, the heart rate will be 300; if there are two boxes, 150; three boxes, 100; four boxes, 75, and so on. It is also possible to determine this graphically, as you can see in the following image.


FC-ECG

Gallardo, L. B. (2018). FC-ECG [illustration]


Activity. Interpretation and analysis of ECG

Individually, each patient has a graphic image of the activity of their heart and can approach normal or pathological.

Therefore, there is a wide range of normal ECGs that follow a certain stereotype and it is necessary to correctly interpret the normal, from where the pathological can be diagnosed.

Recognize how each of the elements depicted in the millimeter paper of an adult patient's ECG is expressed to put into practice the diagnosis you could face.

It is important to make an interpretation of the ECG through a logical ordering and we suggest you use the following:

  • Rhythm
  • Heart rate
  • Electric shaft
  • Wave P
  • PR interval
  • QRS complex
  • ST segment
Start

Self-evaluation 1. Interpretation and analysis of ECG. Electrocardiography induction.

If you have in mind the anatomy of the heart and the conduction system which allows its electrical autonomy, this will help you to make a more precise diagnosis of any problem detected during nursing care.


Start

Self-evaluation 2. Interpretation and analysis of ECG. Electrocardiography induction.

Bearing in mind the anatomy and conduction system that allows the heart, electrical autonomy can favor a diagnosis with more precision regarding some problem identified during nursing care.


Start

Information sources

Basic

Bibliography

Castellano, C., Pérez, M. A. y Attie, F. (2004). Electrocardiografía clínica (2.a ed.). Madrid: Elsevier.

Guadalajara, J. F. (2006). Cardiología (6.a ed.). Méndez Editores.

Guyton, A. C. y Hall, J. E. (2011). Tratado de fisiología médica (22.a ed.). Madrid: Elsevier.

Hanzlick, R. y Rydzewski, D. (1990, septiembre). Heart weights of white men 20 to 39 years of age. An analysis of 218 autopsy cases. The American Journal of Forensic Medicine and Pathology, (11), 202-204.

San Mauro, M. (2013). Anatomía cardiaca: una manera integral de estudiar las estructuras del corazón y los grandes vasos. Buenos Aires: Editorial de la Universidad Nacional de La Plata.

Complementary

Bibliography

Gardner, E., Gray, D. y O'Rahilly, R. (1997). Anatomía. Estudio por regiones del cuerpo humano(2.a ed.). Barcelona: Salvat.

Testut, L. y Latarjet, A. (1967)Tratado de anatomía humana. Barcelona: Salvat.

Williams, R. L., Warwick, R., Dyson, M. y Bannister, L. H. (1995). Gray. Anatomía (37.a ed.). Río de Janeiro: Guanabara-Koogan


How to quote

Gallardo, L. B. (2018). Basic Electrocardiography Interpretation. Unidades de Apoyo para el Aprendizaje. CUAED/ENEO-UNAM. Retrieved on (date) from (link)